SCOM Tuning The Easy Way
IT Service Management
This article will give you a good understanding of SCOM management and how to tune your SCOM environment with the power of Live Maps by mapping your services and components to reduce SCOM maintenance and enhance Service Level SCOM reporting.
Microsoft’s SCOM excels at grouping information into classes, instances, and objects, which makes it easy to understand the data. Within SCOM management packs, there can be a whole host of different classes, and generally, the discoveries tie the classes to a computer or a host.
Many SCOM users map their applications based on the Windows computer classes because their apps must be supported by these computers. So by extension, they have to make sure these computers are functioning in order for the apps to work.
Unfortunately, this method of mapping can cause the alert notifications of these distributed applications to be perpetually in a critical state because these computer classes contain other objects and instances that have no direct support roles for the application that needs to be monitored. These objects and instances (e.g. agents running on the server) can trigger the critical state even when it’s not relevant to the health of the app. As a result, your app may be working just fine, but the alerts you receive are telling you otherwise.
The knee jerk reaction is to go down the time-consuming path of overriding and tuning your SCOM. This requires the reconfiguration of every single computer for every app in your environment. Not only that, you have to fiddle with it again when something changes.
The great news is that you don’t have to go down this tortuous path of reconfiguring and fine-tuning.
In this post, you’ll learn how to maintain distributed applications with Live Maps and proactively monitor them from day one. It’s a walk in the park rather than a climb up a vertical cliff.
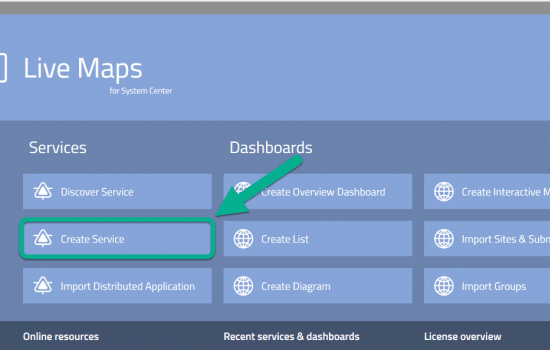
Step 1: Launch your Live Maps Authoring Console.
Create a blank service by using the “Create Service wizard”. Do not forget to name it something the application owner will understand (in this example, we’ll call it Application Apple). Then just click through all the ‘Next” options, until you finish the wizard and the saving service appears.
Once completed, Live Maps will build a blank distributed application in SCOM based on the Live Maps service model referenced. It also sets up SLA tracking and dashboards (there is nothing you can share just yet).
Note: when you create a Live Maps service, a SCOM Management Pack is created as well.
Step 2: While you are waiting for your SCOM to catch up, switch back to the Start Page tab.
Using the “Create a List” or “Diagram” option in the Live Maps Authoring Console, create and name a group for the computers that support the application (e.g. Computers for Application Apple).
Target the List or Diagram into the already created Service MP you made in Step 1.
Step 3: Add the Windows computers, hosts, and network devices to the List diagram you created in step 2.
You can do this by using the following explanations on how to fully automate the group (this type of dashboard in Live Maps is a group in SCOM, which means it comes with its own health state and dashboard ready to share). Now press Save.
Tip from the experts: Multi Save option (top left menu bar) is a better way to save, since it takes just the same amount of time but saves all of your open dashboards and groups in one go)
Step 4: Navigate to the service you create in Step 1.
Start at the infrastructure perspective and create dynamic rules to target the most important parts of the computer group you made in Step 3. In this example, the two main things everyone always wants to know are (1) operating systems and (2) disks.
When you write the rule, make sure to use the Group targeting and target the Computers for Application Apple (or whatever you called it). Since you saved it in the same unsealed MP, it will be referenceable here. If it is not visible, then simply select the group in the tree navigation menu and cut and paste to the correct folder.
Windows Operating Systems is a good example of the right monitor to show the application owners. Not only does it come with performance data, it also will go red when the computer dies for any reason. Add the logical disk rule and you have everything you need to show the Infrastructure part of your service map
Fun Fact: this is now fully automated to the computers in the group – so no more having to redo it when someone changes things! Plus, you’ll have an immediate overview of the performance of just those computers.
Step 5: Before saving the above rules in Live Maps, navigate to the Application perspective of your Application Apple service.
Here we will add dynamic rules, just like we did in Step 4 (targeting the Computers for Application Apple) for the various service components you need for the service owners to see. For example, you can target the websites, IIS application Pools, SQL databases, SQL Engines, Windows Services, or other discovered objects.
Expert tip: You may want to use the advance how to set up drill-downs for this part of your service if the rules populate to many objects on the screen (in general, if there are more than 20 objects, it is recommended to create drill-downs)
Finally, press “Save.” Your service is now fully mapped from a hardware and software perspective. This should enable you to share the dashboard with the service owner and give you a head start on discussing the requirements for the end-user testing that you can place in the end-user part of the Live Maps service.
From this moment on, you will have reduced the noise from the monitoring of the application into service-level alerts which essentially will be a maximum of 4 alerts in SCOM. This means you can safely switch on email notifications sent to the service owners giving you the advantage of going pro-active monitoring with the service owners:
i.e. parts of the service are not green -> click on this link to see the full-service map and health directly in your browser -> work on the alert to achieve healthy service right there and then.
This should also give you a way to show management what monitoring can actually do to make sure the delivery of services is all GREEN! Although using this article will allow you to show them only green dashboards instead of the full-service map.
Do not forget to set this up in your subscriptions in SCOM to reap the full benefits, this article should help you with targeting just the service level alerts only, or you can switch on the Live Maps mobile feature straight away.
These are the simple tricks to get you catapulted into automating service monitoring and reducing alert notifications within minutes in SCOM management.