10 Key Metrics to Assess Microsoft Teams | Martello Technologies
Microsoft Teams Monitoring
10 Key Metrics to Assess Microsoft Teams
Originally posted on gsx.com
This entry is part of our series on Microsoft Teams Performance monitoring. In this article, we will define the meaning of the top 10 compulsory Microsoft Teams metrics to measure the ability of your locations to provide a decent user experience before, during, and after any deployment. The following are the top Microsoft Teams metrics to focus on.
Get your guide and take the immediate steps to optimize the Microsoft Teams experience. Free to download!
Key Metrics for Microsoft Teams
1. Latency (One-Way and Round-Trip)

- It measures the time taken to send a data packet from point A to B and come back. It is tied to the physical distance between the two points and the speed of transmission and the overhead taken by the routers in between.
- The latency impacts the smoothness of the conversation between two people
- Increased latency provides unnatural pauses during the conversation
- People also report that it feels like using a satellite phone
- In the end, it leads to having people talking at the same time
- Everybody has already experienced that
2. Packet Loss Rate
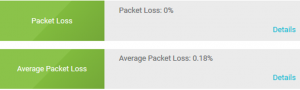
- Microsoft recommends keeping it at 1% during a 15-second call
- Inferior to 3% should provide a decent call quality
- Between 3 and 7%, there is a noticeable impact
- Over 7%, the call quality will be severely lacking
- It represents the amount of packet lost for 15 seconds (for example if 1000 packets are sent in 15 seconds and 50 are lost, it will generate a 5% packet loss).
- This measure is extremely important in VoIP as it used as one of the elements to determine the MOS that we will explain right after.
- A high packet loss will lead to a moment of silence during a call (if you have a period of sustained packet loss during a call) or to a degradation of the voice quality giving people ‘robot-voices.’
3. Packet Reorder Ratio
This statistic is now considered equally as important as packet loss, because packet reordering severely degrades the call quality. High rate flow network has a greater chance of packet reordering.
Packet reordering (when packets arrive in a different order than that in which they were sent) can be recognized as packet loss or as a congestion signal by most network protocol (like TCP). Therefore, they impact the Network MOS the same way as packet loss. On top of that, they can directly impact the packet sending rate which will also increase the round-trip time.
As a result, the call will be distorted and will cut out at times. The threshold where you need to be alerted is usually 0.05%.
4. Jitter (Packet Inter-Arrival Jitter)

- Audio packets are sent at regular intervals on the network. But that doesn’t mean that they are received with the same regularity (usually because of network latency). That is why a buffer is needed, it waits for all the packets before reconstructing them in the correct order.
- The Jitter is the size of the buffer that is needed to store packets before reconstructing them in the correct order. It can be compared to an audio packet waiting room. The value of the Jitter is calculated over every period of 15 seconds.
- A low Jitter number means that the connection to the call is good and solid.
- A large Jitter buffer provides additional delay in calls. It is the sign of a congestion of the network.
- The shrink or the expansion of the buffer will provide audio distortion during the call like speeding or slowing down of the speech.
- As for packet loss, the Jitter value is used in the Network MOS determination.
5. Network MOS (Mean Opinion Score)

This concept needs a little bit more of an explanation.
The MOS is usually a score that is based on a questionnaire sent to the users, like the one you have after each call on Skype, Teams or WhatsApp: “Please rate the quality of the call from One to Five stars” (5 being excellent, 1 being poor).
That is why you can’t have a MOS superior to 5. The problem is that when you want to assess your environment or even during migration you don’t have any or enough feedback to get this score.
That is why Microsoft has worked with other network specialists on the definition of Network MOS metric that can predict what will be the value of the Wideband Listening Quality Mean Opinion Score (MOS-LQ).
To calculate that, multiple factors are considered such as the latency, the packet loss, Jitter, the codec used, etc.
As for the real MOS, the Network MOS ranges from 1 to 5. But because of the compulsory impact of the audio codec, the highest score is usually around 4.4.
How to Use the MOS Value?
The Network MOS is a perfect tool to identify if the network conditions are impacting the end-user audio quality experience. It can be used to identify a wide range of issues.
The first way to analyze it is to compare it with a previous average value in time to understand if you are dealing with a degradation of the audio quality or not.
Then, you can combine this information with the packet loss or Jitter to understand what is causing that degradation and in which location. And that is why you need to constantly measure this parameter from all your sensitive locations.
The best example of root cause is the LAN Congestion.
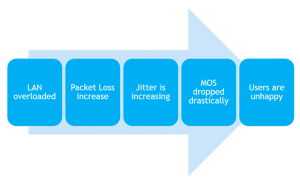
When your LAN starts to be overloaded, the rates of packet loss and amount of Jitter is increasing for all calls going through your LAN.
This will automatically be seen in the MOS score.
If you trend your MOS score you’ll be able to understand exactly at what time and where the LAN was congested, determining your peak time and adjusting your network to prevent this issue from happening again.
We see here how important it is to constantly monitor all these specificities to be able to take proactive actions before users start complaining and opening tickets.
6. Network MOS Degradation
Another way to analyze the MS Teams end-user experience delivered to your remote location is to understand the Network MOS degradation.
This statistic directly shows the impact of the jitter and the packet loss on the Network MOS. It is generally recommended to keep the value under 1. The higher this value is, the worse the quality of the call is.
Usually, a high value of Network MOS degradation causes distortion in the audio or a blank during the conversation. This is generally due to LAN & wireless congestion and/ or insufficient bandwidth, which directly impacts the rate of packet loss and average jitter.
The statistic is interesting as it is less impacted by the CODEC used during the call than it is impacted by the actual MOS. Knowing this, you can analyze the metrics to understand if the loss of MOS is mostly due to jitter or to packet loss and then troubleshoot the issue.
How Packet Loss and Jitter are Related to the Network MOS Score
The packet loss plays a very important role in the Network MOS calculation. Over 20% of packet loss, your MOS cannot be higher than 2.5.
The latency round trip won’t affect the MOS if it stays under 100ms.
If the Jitter stays under 50ms, the MOS will be as high as it can. When the Jitter rises, the MOS degrades quickly.
Basic Recommendation on Network MOS
As the MOS is a prediction of the end-user experience of audio quality, it is important to constantly measure it. Jitter and the Packet loss should also be measured frequently. Make sure that the Jitter value stays under 50ms, the packet loss as close as 0% as you can and of course the latency under the 100 milliseconds.
Now that we’ve seen what kind of statistics you should collect, let’s see what is recommended as a collection process.
7. Ratio Concealed Sample Average
An audio sample can be concealed to deal with lost network packets. It is a simple solution to smooth out the abrupt transition that is caused by dropped network packets. That is why these statistics is called “Healed Percentage”.
A high percentage means that many audio samples had to be concealed because of the packet loss. It indicates poor audio quality, which the user experiences as distorted or lost audio.
Usually, it is best to keep the ratio around or below 2%. Over 2% will gradually degrade the audio quality. Over 7%, end users will likely end the call.
8. Estimated Bandwidth (Minimum)
This provides the bandwidth values on the client side during the 15 second test call.
MS Teams adapted well to variation of bandwidth by reducing or increasing the packet sending rate. However, bandwidth naturally has a huge impact on the audio quality. Generally, when the bandwidth is under 100Kbps, the quality of the call is degraded. Video calls are even more sensitive to bandwidth variation and packet loss, which is why it is very important to measure bandwidth and keep it within the Microsoft recommendations.
9. Estimated Bandwidth (Maximum)
Thanks to the GSX Robot Users, you have an easy way to test and collect every statistic you need to assess the readiness of your environment to deploy MS Teams. For further information on how the Robot Users are providing you with MS Teams end-user experience metrics, please read this article >>
You also have a way to easily store and analyze the statistics thanks to our PowerBI reports.
Now, let’s see how to analyze them! First, what should be the results if you want to pass the exam?
10. Estimated Bandwidth (Average)
Microsoft recommends that you perform the test from 2 different “exit points” to analyse what part of your network might cause an issue.
For each location you should have a Robot User performing your tests:
- Directly from where the clients sit to the Microsoft Edge
- From your infrastructure’s Edge to Microsoft Edge
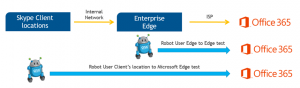
This will give you a pretty good understanding of how your infrastructure is decreasing the call quality of the Teams services.
Here are the recommended values for each of them:
| Name of the Metric | Client to Microsoft Edge | Customer’s Edge to Microsoft Edge |
| Latency (on way) | < 50ms | < 30ms |
| Latency (RTT / Round trip time) | < 100ms | < 60ms |
| Packet Reorder Ratio | < 0.05% | < 0 .05% |
| Packet loss | < 1% during any 15s interval | < 0.1 % during any 15s interval |
| Average Jitter during call | < 30ms during any 15s interval | < 15ms during any 15 interval |
| Network MOS* | > 4 | > 4 |
| Network MOS degradation | < 1 | < 1 |
| Concealed Sample Average ratio | < 2 | < 2 |
| Bandwidth Estimate for audio | > 100 | > 100 KBPS |
| Bandwidth Estimate for Video | > 300 KBPS | > 300 KBPS |
*Network MOS: The MOS score target is usually always the same. A MOS > 4 will provide good audio quality. The closer you are to 4, the smaller distortions you will experience but it will be acceptable.
Between 3 and 4, you can still use the audio (the closer to 4 the better of course) but some users will be impacted by all the issues we explained earlier. It means that you should look at the location to see if you can improve the network quality before deploying MS Teams.
If you have locations with a MOS under 3, you shouldn’t deploy Teams yet. It will create more tickets and frustration than anything.
A heavy look in your network is necessary before doing anything else.
What To Do With These Values
Now that we have the targets, it is important to compare them with your locations’ values over time.
For that, you want to know what your peak times during the day and during the week are.
It is easy to recognize them with your PowerBI reports that draw all your statistics over days and weeks. You can then identify what are your key moments of the day/week and compare the results of your tests with the Microsoft recommendations.
Finally, as most of the business activity also has a monthly pattern, it is important to keep monitoring this activity for several weeks. You’ll be able to identify these patterns and make sure that you’ve discovered all your peak times.
You’ll see if your network can handle them. If not, you will know directly which location fails and exactly at what time and period of the month.
You’ll be fully prepared to improve the network or handle the users’ complaints.
Microsoft Teams Metrics – Reaching the Target
From a general point of view, to reach these targets you should make sure that:
- The latency one-way is stable during busy and non-busy hours
- The latency RTT is stable and stays close to twice the latency one way
- Packet loss are not increasing too much during busy hours (it is normal if it rises)
- Jitter does not increase too much as well
- Edge connection tests stay better than client connections ones
If all your locations pass the exam during busy and non-busy hours, you can be confident in MS Teams services. User complaints and tickets should stay low, ensuring the best ROI you can have.
But as your infrastructure and the way to use it is in constant change, you should continue to monitor these MS Teams metrics to prevent any crisis, and to predict potential issues at particular locations.
To do so, you must let your Robot User keep working for you.
What Happens If a Site Fails?
Data Collection and Interpretation
We already explained in the statistics description how each of them has an impact on the audio quality. Now, let’s see an example of a site failing the tests:
| Metric | Target | Result Busy hour during a normal day | Result busy hour during the busiest day of the week |
| Latency one way | < 50ms | 40ms | 38ms |
| Latency RTT | < 100ms | 81ms | 77ms |
| Packet reorder ratio | < 0.05% | 1% | 2% |
| Packet Loss | < 1% during any 15s interval | 4% | 5% |
| Average Jitter during call | < 30ms during any 15s interval | 25ms | 35ms |
| Network MOS | > 4 | 3.7 | 3.3 |
| Network MOS degradation | <1 | 0.7 | 1.2 |
| Concealed Sample Average ratio | < 2 | 1.7% | 2.1 |
| Bandwidth Estimate for audio | > 100 KBPS | 150 KBPS | 50 |
| Bandwidth Estimate for Video | > 300 KBPS | 150 KBPS | 150 KBPS |
Action Plan for Failed Sites
Basically, what’s going on here?
Most of the results exceed the target. Clearly, during the busiest day of the week, the network cannot handle the peak time. The site won’t be able to provide a good MS Teams quality of service.
So basically, the calls will have reduced quality (PSTN, peer-to-peer and conference):
- Users will experience a moment of silence during the call
- They will hear a robot voice for each of the participants
- The speech of the participant will suddenly slow down and then speed up
At the end, the quality will be poor, users will complain, you will have plenty of tickets coming from that location, increasing your administrations costs as well as your user dissatisfaction.
If you have a similar result, you should definitely investigate improving your network before deploying MS Teams.
Finally, the constant monitoring of each site option of the set of Microsoft Teams metrics allows you to easily rank each of your sites and organize them by ROI.
| Site | Number of users | Sensitivity | Results | Cost | ROI | Actions |
| Boston | 1000 | High | Pass | Zero | High | Monitoring |
| Geneva | 500 | Low | Fail | High | Low | Stand-By |
| Singapore | 200 | High | Fail | Medium | High | Network improvement |
For each site, it is very important to understand the ROI of your network investment.
Sometimes small sites have highly sensitive people and even if the network improvement will be important, the ROI will still be high (like in our Singapore example).
Some other time costs are too high to help remote sites compare to the benefit you will get. In our case, the Geneva costs outweigh the benefits.
Trace and Enhance Your Teams Performance
The type of Microsoft Teams metrics your team should focus on depends on your organization and what you’re looking to achieve with the platform.
But before going through extensive network design and investment, maybe a first set of simple improvements could enable your organization to provide a decent service across most of your sites.
For more resources and information on how Martello can help, read our articles on free tools to monitor Microsoft Teams performance and visibility in the Microsoft Teams user experience.