How do Martello iQ and Microsoft Azure Monitor Compare?
IT Service Management
By Peter De Tender, Business Program Manager—Azure Technical Trainer, Microsoft
Monitoring health and usage information is a critical maintenance task for any site or application, whether it’s running in your on-premises datacenter, hybrid or public cloud environment, or hosted environment.
Today’s challenge is that enterprises still require end-to-end monitoring insights of their running (and not running) application workloads, while also knowing that they are losing ground on the physical characteristics of managing their own datacenters. Monitoring health and availability adds another layer of complexity. IT teams are watching over the technical computing, data, and application layer of the workloads, but there is also a desire (and often a need) by non-technical teams, to get a real-time or near real-time view on the overall health and uptime of business-critical workloads. Service Level Agreements relating to both the infrastructure and applications, number of incidents, and system performance are only a few of the monitoring indicators that could heavily influence an organization’s business decision making.
Microsoft Azure —which we are using as a reference point in this article—provides different Azure monitoring services and tools as part of the services family. These are centralized in Azure Monitor, which provides an end-to-end view of cloud resources, whether they are running in Azure, another public cloud, or in an on-premises datacenter.
At the same time, several third-party solution vendors have been building powerful higher-level monitoring tools, which allow for a single view of the health state of business systems and solutions, sometimes this is extended with more-detailed service-level views. Martello’s Vantage DX is the product we are looking into here, positioned as a service monitoring and analytics platform.
This article aims to provide an overview of both Azure Monitor and Vantage DX from a use-case perspective, outlining the core features of each technology, and looking at what features are available in the one solution but lacking in the other, the strengths of each solution, and closing with a wish list of capabilities to make Vantage DX even better.
Martello’s Vantage DX Overview
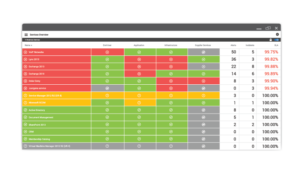
Vantage DX is not a systems and platform monitoring solution by itself, but rather a tool for collecting information from different sources, and presenting this in customizable dashboard views.
The main intelligence and analytics outcome is derived from gathering metrics from several other monitoring tools (for example Azure Monitor) and simplifying service level agreement views and incident dashboards.
Rather than using Vantage DX as a (technical) systems monitoring solution, the core objective is consolidating technical information about systems health, availability, network performance, and the like. From here, dashboards can be created and customized, presenting the information in a higher-level view, allowing you to drill down into more detail and finding the resource or object that’s reporting issues if required. For troubleshooting the real root cause of an incident or problem, one should go back to the ‘actual’ monitoring tool and go over any necessary troubleshooting steps there.
Vantage DX doesn’t interact with any data centre or application resources directly, but instead pulls in information by using platform and service connectors. The list is rather extensive, but these are some of the more common ones, allowing for a cross-services view:
- Amazon Web Services (AWS)
- BMC Remedy
- Jira Software
- Microsoft Azure and Office 365
- Microsoft System Center Operations Manager
- Nagios
- PRTG Network Monitor
- ServiceNow
- SolarWinds
- Splunk
- VMWare VCenter
- WhatsUp Gold
- Zabbix
Offering integrations with these connectors is one of the main strengths of Vantage DX, I would say. This allows for public cloud application landscape monitoring (e.g. Microsoft Azure) and hybrid-cloud monitoring (System Center, Nagios, Zabbix), as well as drilling down into network packet-level monitoring using PRTG for example. It also allows for gathering and sending information across IT Service Management (ITSM) solutions like Jira or ServiceNow.
Azure Monitor Overview
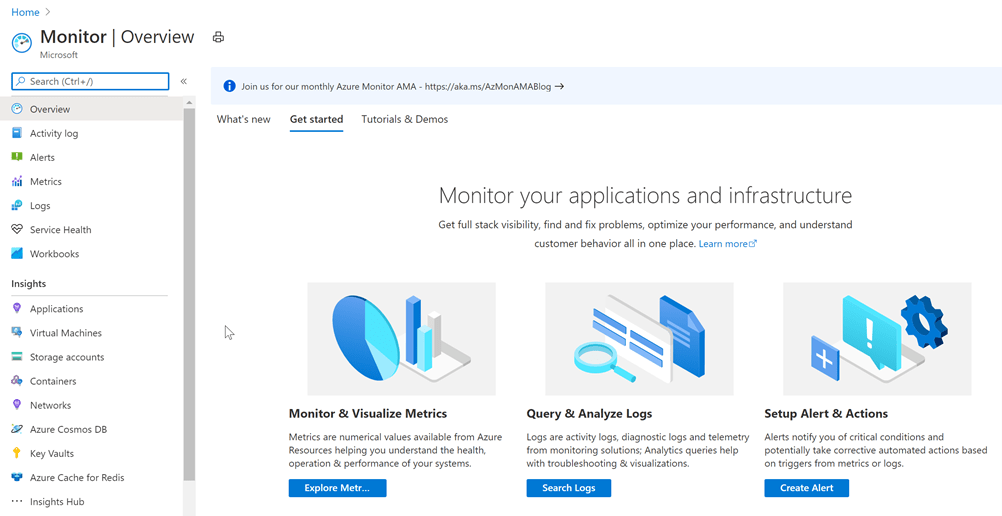
Given the breadth of services and resources in Azure, it is challenging to provide a complete monitoring solution for “the cloud”. As mentioned in the overview section, monitoring a workload service running in a data centre—whether private, hybrid, or public—is challenging. Even more so in public cloud, as the consumer of the application workload is not managing the full data centre layer. If the application runs inside Virtual Machines, one can monitor more details about the underlying infrastructure, than when the application runs as a Platform Service or Serverless (e.g. Azure App Services, Functions, Logic Apps).
Azure Monitoring tries to be the solution for this challenge, by providing different “pointers” in the Azure platform, allowing for monitoring of a range of specific scenarios:
- Metrics
- Alerts
- Resources (Virtual Machines, Network, Storage, Containers)
- Application Insights
- Azure Log Analytics
As soon as you deploy an Azure Resource, data collection starts running in the background, allowing you to retrieve information from the Metrics or Insights option within the resources “Monitoring” properties.
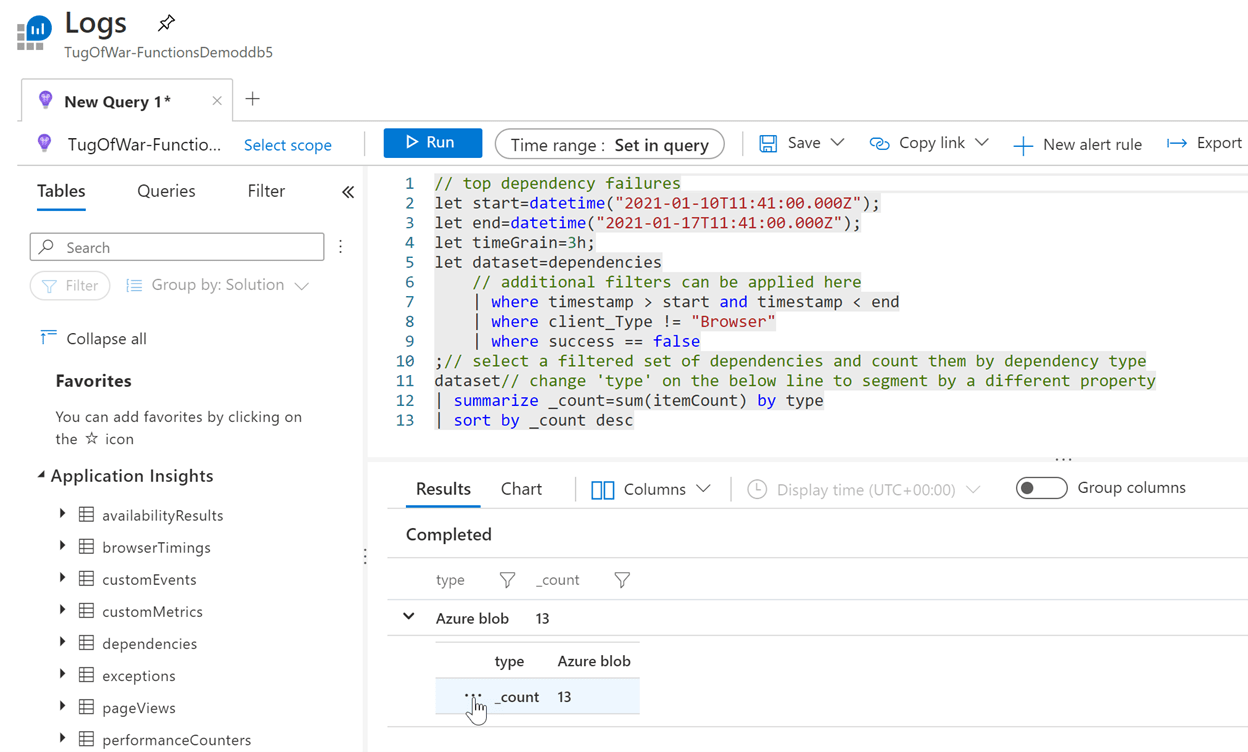
Figure 3: Azure Log Analytics query, analyzing failed requests from a web application to Azure blob
Azure Log Analytics
Besides metrics, which are typically used for short-term (30 min – 24 hours) or near-short-term (1 week-30 days), Azure Monitor wouldn’t be complete without Azure Log Analytics.
Azure Log Analytics—as the name says—provides an organization with a centralized repository of resources’ logging information, pulled from Azure Monitor metrics, Azure storage log files or deployed Log Analytics agents (typically to hybrid-running Virtual Machines). Using a powerful Kusto Query Language (KQL), pretty much any data you are looking for can be retrieved.
Can the Two Products Be Compared?
The initial goal was to provide a comparison between Azure Monitor and Martello iQ.
However, since Martello iQ is relying on Azure Monitor as a data feed, it is hard to put them next to each other. As honestly, without Azure Monitor, Martello iQ wouldn’t be able to monitor Azure Resources—unless using another third-party agent, and that would still only allow monitoring of Infrastructure as a Service, basically Virtual Machines.
Forgetting this dependency for a minute, one could summarize each product as follows:
Azure Monitor: The Azure monitoring and management solution allows for end-to-end monitoring of Azure Resources as well as hybrid IT data centre assets and solutions. By using metrics and log file information, Azure Monitor provides dashboard views of the overall health and operational state of these monitored platform services. The focus is on technical aspects.
Vantage DX: A platform-independent service level management and monitoring solution, oriented around dashboard views. By using third-party connectors to different services, solutions, platform,s and clouds, Martello allows for quick identification of your overall application services uptime. The focus is on the service level management aspects.
So in short, both products are serving a different purpose, where the use cases and user audiences are (typically) also different. The real power lies in combining both, in my opinion.
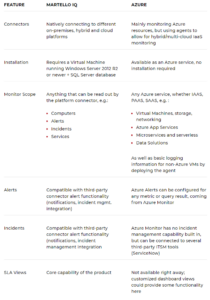
Feature Mapping
In this section, I will try to provide an overview of key features within each product, starting from a Vantage DX perspective. Followed by an indicator if this is a plus or minus compared to what Azure Monitor provides.
Use Cases Where Martello’s Vantage DX Is Recommended
- The first main use case where Vantage DX is a true differentiator is the power of its Service Level Management dashboard views. In a split second, you can immediately identify the health state of an individual service or service collection (like a workload based on multiple servers and components).
- Understanding the criticality of systems and application workloads, based on both IT admins but also end-user input is a very powerful feature for troubleshooting environments and defining overall health state. It could be that an application is down for an end-user, but the system itself is not immediately reporting this. At the same time, a system could be down, but given the high availability of the workload, it might not immediately impact the end-user.
- A third feature that makes Vantage DX interesting to use, is the complete Service Level Agreement (SLA) dashboarding views, both as a high-level SLA presentation, but also for allowing the users to drill down on any relevant details about uptime of any individual components of a workload.
- Finally, Vantage DX can be a powerful tool for organizations with a true hybrid environment, where information must be collected across different environments, which by itself could be multiple Azure Tenants or different Azure subscriptions within a Tenant, as well as any possible public cloud or on-premises data centre scenario.
Summary
In this article, I have tried to provide an answer to the common question of relying on Azure Monitor only, or integrating a third-party monitoring tool, like Martello iQ. I have also tried to give you my honest view of how both products are more complementary to each other than competitors, given the specific focus of each product. Azure Monitor and Azure Log Analytics provide a technical view on your IT landscape, whereas Vantage DX has a core focus on providing service level management insights.
Martello extends the possibilities of your Azure Monitor solution to analyze data, streamline alert and incident workflows and create business value dashboards instantly.