
Martello’s Vantage DX unifies all of your disparate monitoring tools, cloud platforms and ITSM systems. It improves troubleshooting, decreases downtime and makes reporting easier. Based on Elasticsearch it can handle millions of IT alerts, correlating them to understand the business impact and automate incident workflows. Quickly find all of your Windows computers or order entry alerts by using natural language searches. Easy-to-use straight out of the box, your team can start analyzing data, streamline alert and incident workflows and create business value dashboards instantly.

VMware SCOM Management Pack Alternative

Monitor VMware health status for a fraction of the cost

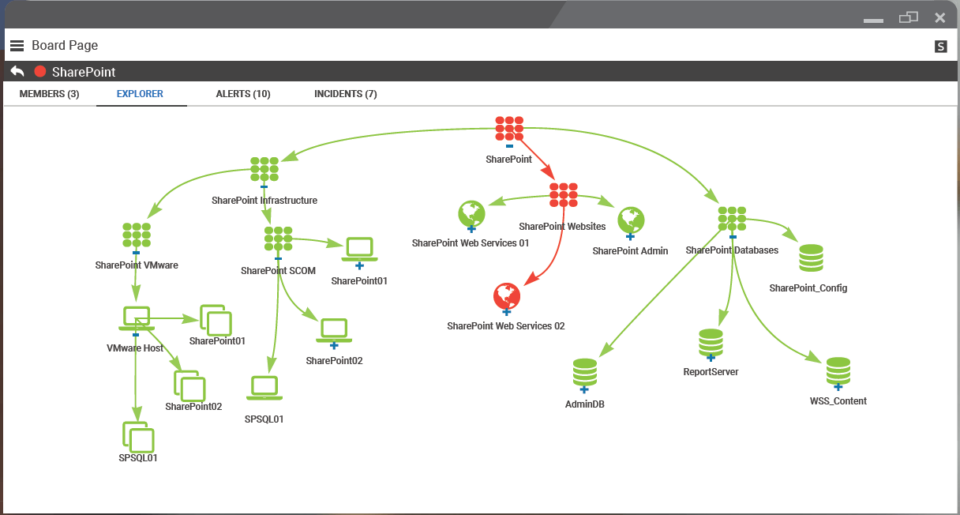
Do you need a single overview of your virtual environment and your SCOM monitoring data? With Martello, you will be able to achieve that at a fraction of the cost of the most common VMware SCOM management pack. Martello is super easy to use and does not require any complex maintenance. It provides you with the features you need, without adding any intricacies to your monitoring.

Martello continuously ingests monitoring data from your SCOM and VMware instances and stores it in an ultra-fast Elasticsearch database. The data can then be easily organized, analyzed, and visualized in our customizable dashboards.

savision screenshot

For VMware vCenter and Martello customers this means having the power to:

  • Monitor VMware health status for a fraction of the cost.
  • Create and customize business value dashboards for monitoring service and device health, SLAs and financial impact of outages.
  • Calculate SLA’s coming from VMware and share with the CxO, or helpdesk so everyone has access to the data.
  • Store devices and all relationships that are discovered by VMware.
  • Efficiently show how all objects are related to one another, helping to quickly analyze a problem and improve MTTR.

Functional Specifications

  1. Retrieval of all host systems and virtual machines.
  2. Retrieving health states of objects based on overall status (gray is unknown, green is healthy, yellow is warning and red is critical) and maintenance mode is based on runtime in maintenance mode.
  3. Retrieval of the relationships between the hosts and virtual machines.
  4. Retrieving active alarms from hosts and virtual machines and translating them into alerts.
  5. Alarms from hosts and virtual machines can be acknowledged.

Don’t see your integration?
Custom integrations are available upon request.

Return to top