Challenges with Microsoft Teams Usage and Service Quality

Assessing Microsoft Teams voice usage and its quality of service for a specific city or office or even for external service providers like ISPs, SIP trunk and carrier or a Microsoft datacenter can be highly difficult when using Microsoft tools.

There is limited flexibility to perform conditional searches through the Teams Call Quality Dashboard (CQD). This makes it really difficult to understand how Teams Voice is used and how it performs on key components of your organization such as users, devices, offices, countries, cities, etc.

As a result, finding the consolidated information you need to make decisions on where to focus your efforts is time consuming and unreliable. This makes efficient improvement and resolution of service quality issues a challenge.

Why is Microsoft Teams Service Quality Important?

It is critical to understand how Teams Voice is being used, by who, when it is being used, with what connection and with what level of service quality when you are looking to improve the overall satisfaction of your users. Access to these details allows you to prioritize the work you have to do and to coordinate the necessary teams that need to be involved.

When you look at external service providers for example, being able to determine the usage and performance of an ISP, a SIP trunk, or a Carrier is fundamental to effectively negotiate with them on service quality objectives.

And it is also important internally to understand which office needs a better network, which user device is responsible for service degradation or which meeting caused you the most problems in the last week.

Deeper Dive

Martello Vantage DX uses one of the most powerful data intelligence technologies to enable complex multi-conditional searches that automatically gather and consolidate the relevant data for your analysis.

Now, based on the feedback of close to 3 million Enterprise users Martello has created predefined searches that provide actionable insights in just one click.

You want to see your offices ranked by their number of issues with details on teams Voice usage per call type, the top users, the PSTN devices in use and the type of problem experienced there? Available with one click.

Need to check how your ISPs services are used, with which devices, to perform which type of calls, how many of them and to identify what network or poor call quality issues have happened? A single click will give you the information.

Looking for the same level of details for each PSTN Carrier, Trunk or Microsoft Datacenter used by your users? All at your fingertips.

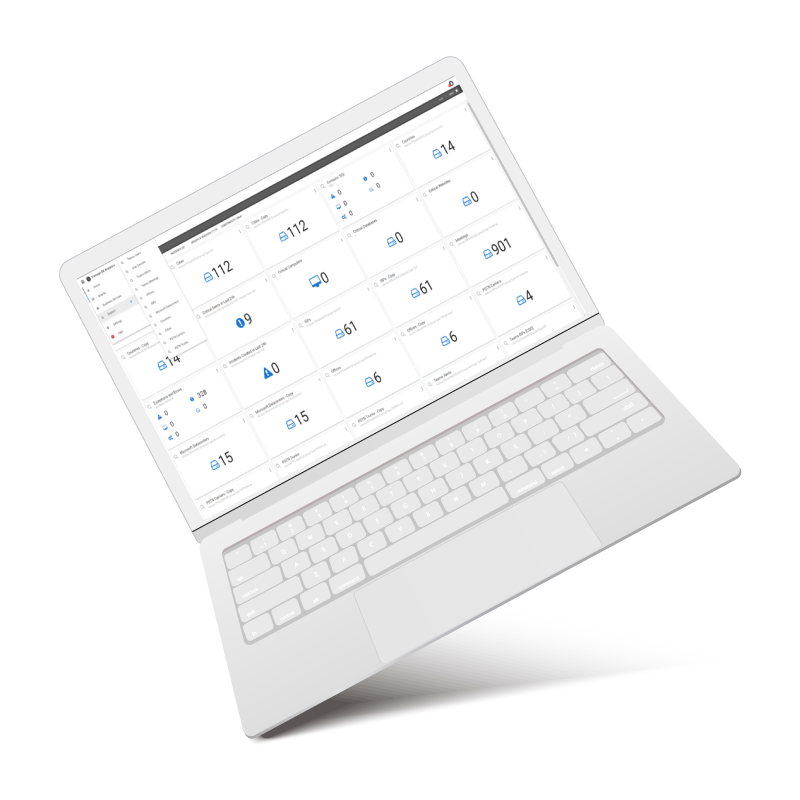
The data is already consolidated to easily see the type of activity, the type of devices in use, the type of problems, the top users and their usage of Teams Voice – all available in just one click.

With Martello Vantage DX, the Microsoft CQD data is elevated and displayed in a way that gives IT professionals the information they need at a click of a button, to prioritize their efforts and resolve problems faster.

Vantage DX Call Quality Dashboard

The Results

Graphic Close Up Icon

Your key consolidated performance and activity metrics available in one click.

Performance Monitoring Icon

Assess your service quality & understand your most critical issues in seconds instead of hours.

Global locations icon

Drill down from country to city to office to users to device usage and issues without any effort.

Performance icon

Answer to management and solve your problems faster.

Resources

Microsoft Teams Call Quality Dashboard
Blog

New Microsoft CQD Saved Searches

Read more
eBook

Beyond the Microsoft Teams Call Quality Dashboard

Read more

Deliver a smooth Microsoft Teams quality of service, on every call.

Return to top