The Who, What and Where of Teams Call Quality
Microsoft Teams Monitoring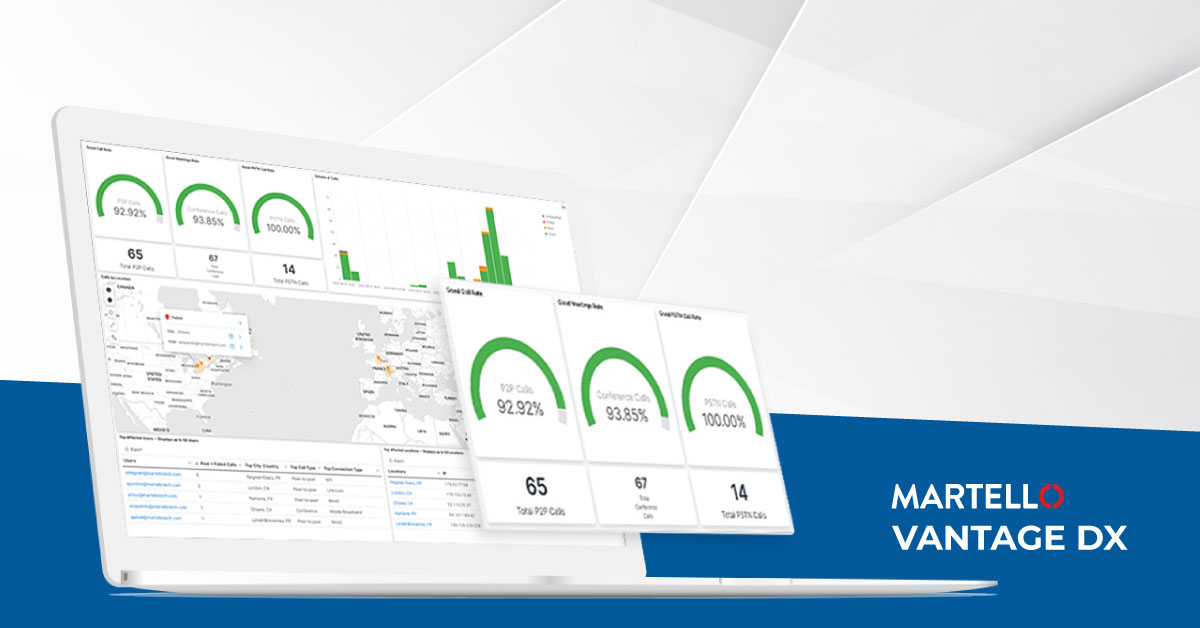
Microsoft Teams is the world-leading collaboration and productivity tool for today’s hybrid workforce, but your users’ experience with it is only as good as the network and IT environment it operates in. There is a critical visibility gap when it comes to delivering a stellar Microsoft Teams user experience to your users. Organizations lack an end-to-end picture of what problems are happening, what is causing the problems and who is affected.
The new release of Vantage DX takes aim at this problem with at a glance Microsoft Teams call quality insights into the user experience of Teams calls of all types, pointing IT teams to the most critical issues impacting users, to eliminate guesswork and resolve problems faster. Check out the Top 10 Questions to Ask about the Microsoft Teams User Experience and read on to understand how Vantage DX provides the answers.
Questions: How many Teams calls are good quality vs. poor quality? Does this vary by call type, location, and are certain users more impacted than others?
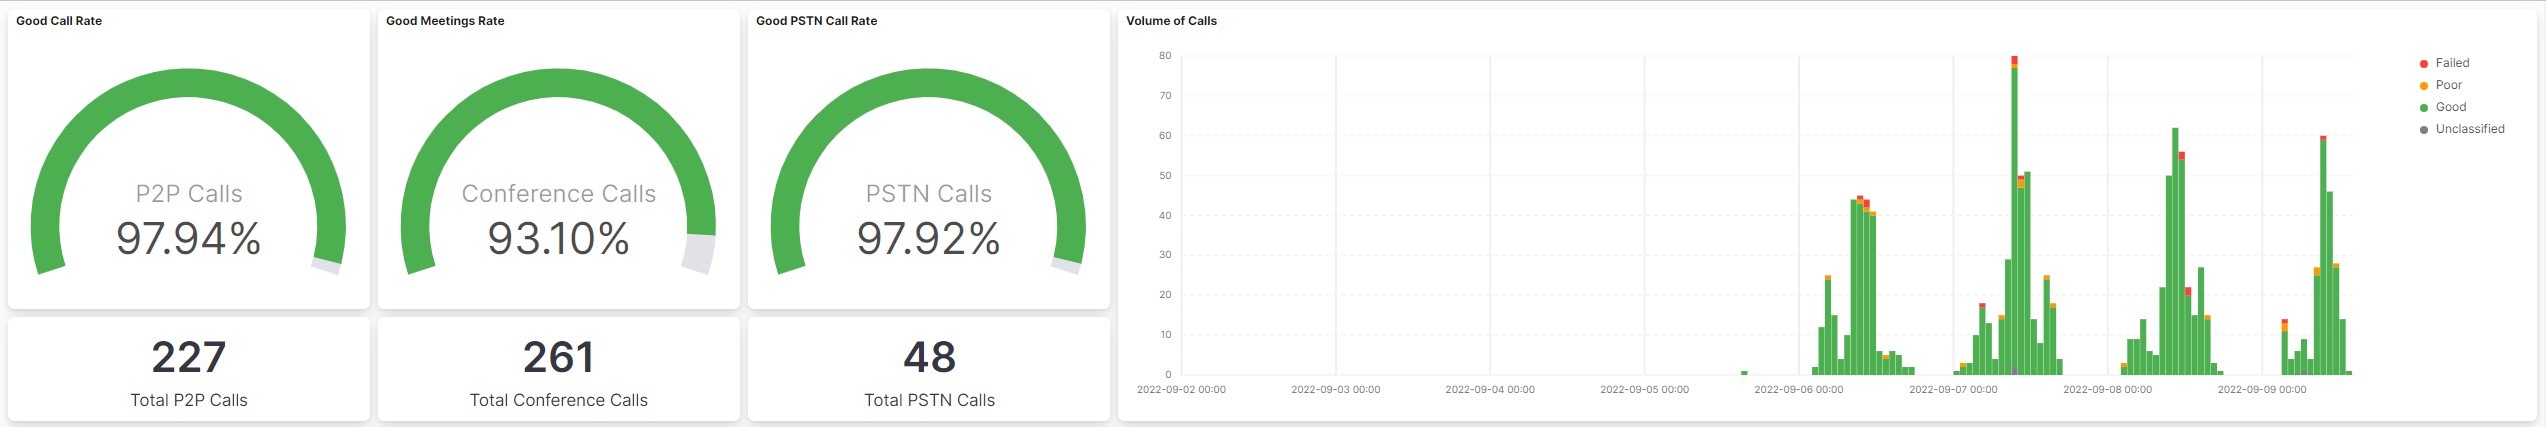
Vantage DX answers: The Teams Overview dashboard in Vantage DX provides Microsoft Teams call quality insights and shows all of the Microsoft Teams calls in your organization, with the percentage of calls that were Good, Poor or Failed. You can also see the quality of these calls by type: how many Good, Poor or Failed calls were Teams Calls, Teams Meetings or Teams PSTN Calls.
There is also a geographic heat map that shows you at a glance which regions are experiencing the highest volume of poor calls, so you can focus IT resources on the most critical locations and users. A heat map displays priority locations, and you can filter on Good, Poor, Failed or Unclassified calls to increase visibility. Hovering on a pinned location will show you relevant data such as location, number of users at that location and the number of users affected.
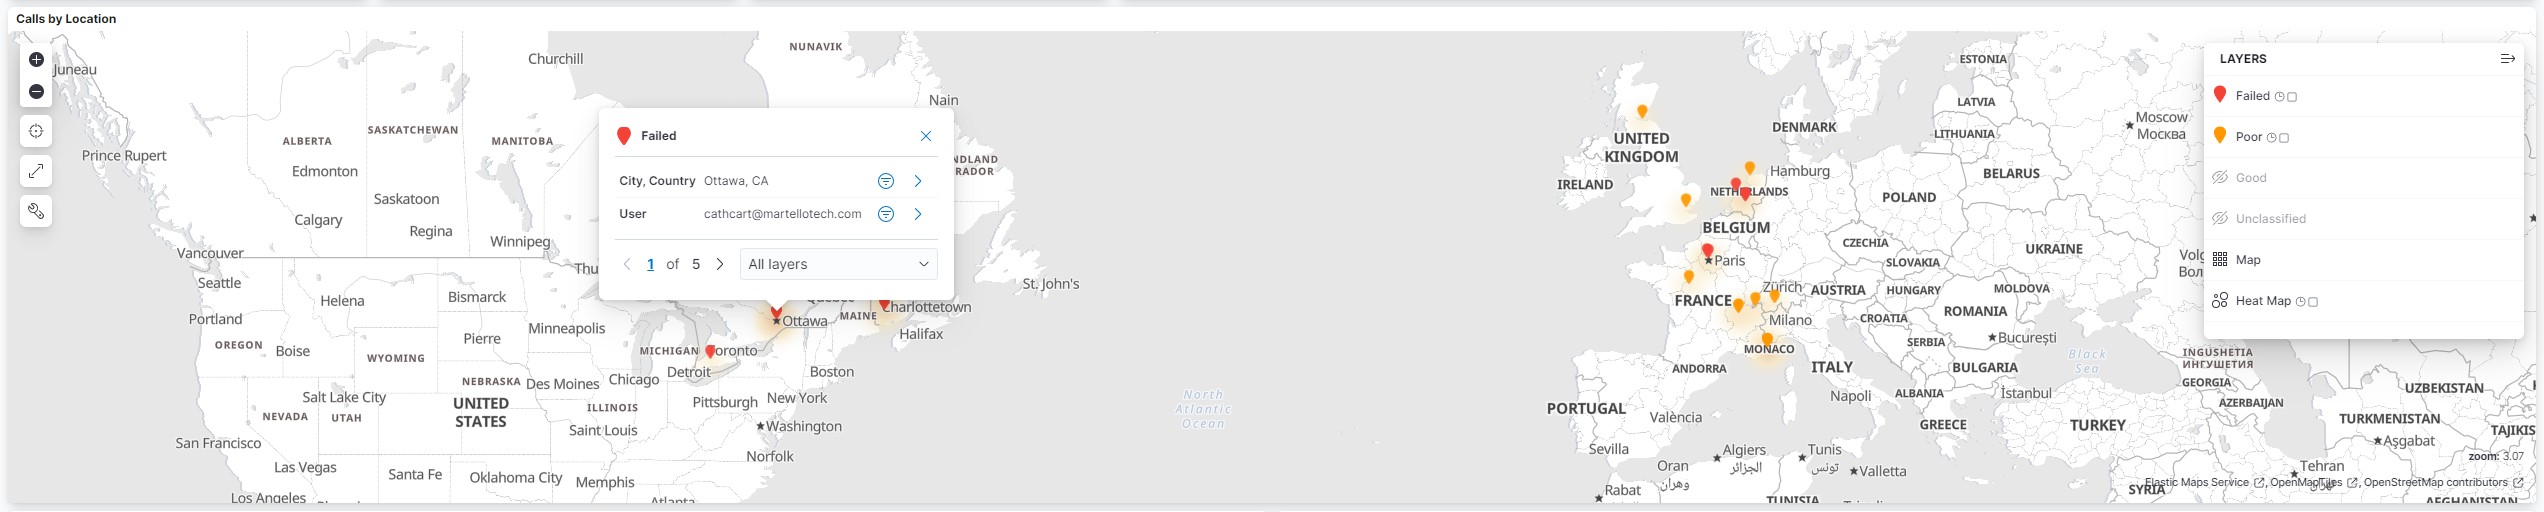
The global heat map allows you to quickly and easily determine visually if a problem is global or local or individual. It can also help you easily determine when remote users (travelling employees, home based employees etc.) are having Teams performance issues, that the issue is likely the local network (one remote employee experiencing poor Teams calls vs the office-based employees who are not). IT personnel can use the map to prioritize their workloads based off of the number of red or yellow “pins” by concentration or location (HQ vs remote employee).
Another way to identify which users and locations are most impacted are the Top Affected Users and Top Affected Locations reports.
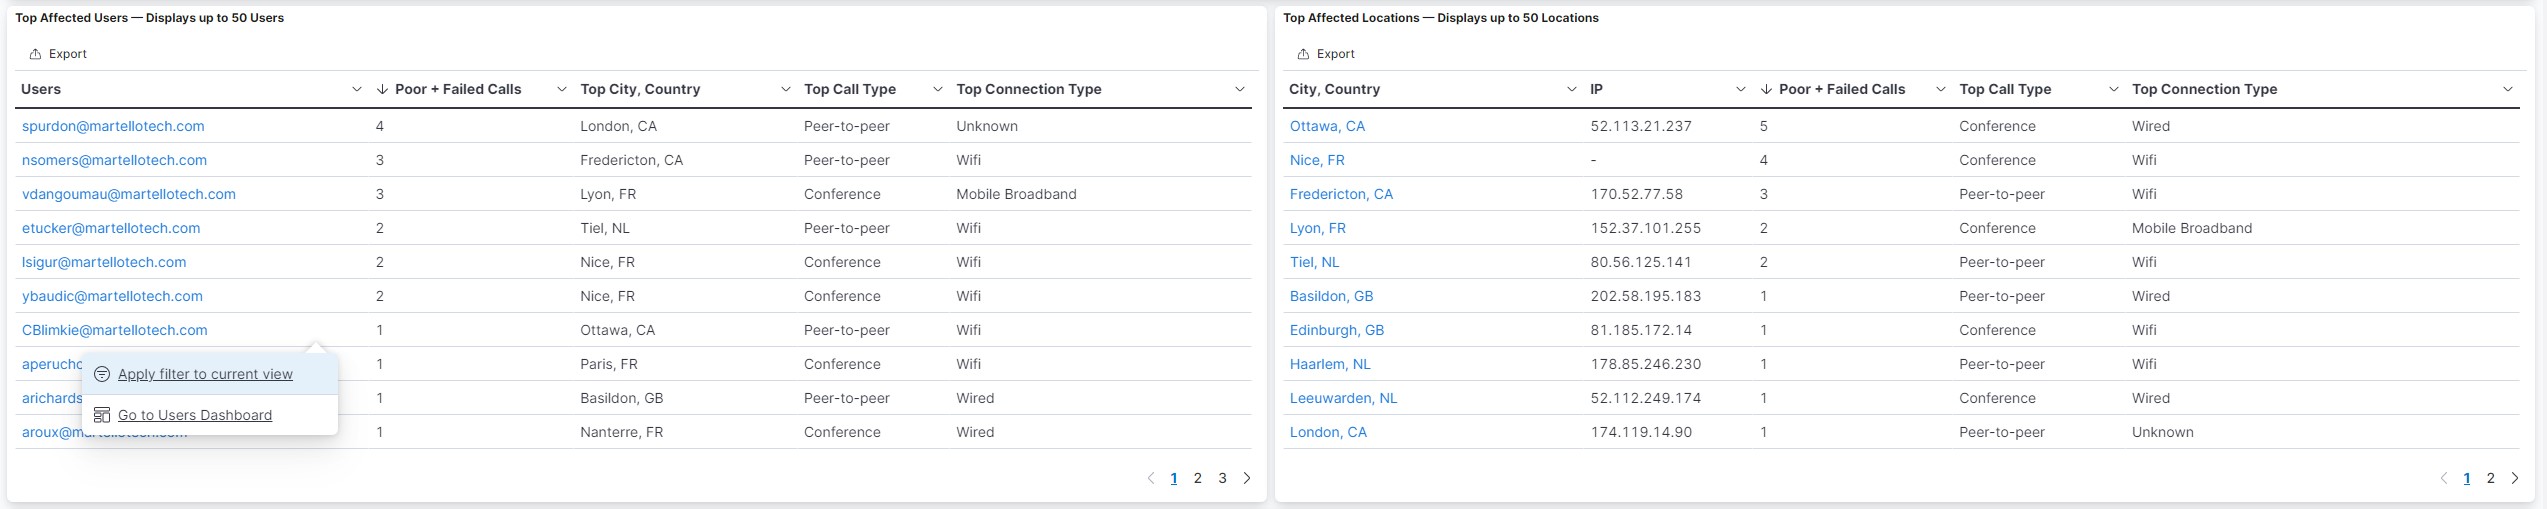
These reports surface the end users and locations having the worst Teams calling experience. Rather than rely on users to complain or raise a ticket, you can take advantage of proactive monitoring and reporting to know there’s a problem before the end user does, with the help of these reports. In many organizations, employees with consistently poor experiences come to accept that their calls are poor quality, and this can lead to lagging adoption and usage. This report provides just enough detail to understand why a problem may be occurring (i.e. call type, connection type).
Access to this level of data can lead to improved employee morale and productivity, as IT proactively remedies the issue causing poor quality calls. It can also help protect Microsoft Teams SLAs and drive internal IT processes. These reports can also help solve the root cause faster – for example, if the top affected users are all from the Toronto office using a wired connection, then perhaps the issue is local. It can also help you gauge quickly whether there is a global outage occurring.
These reports can also help IT teams to quickly and easily prioritize their work based on worse location conditions, and can identify aging networks and/or equipment for replacement or upgrade.
Watch for the next edition of this blog series for more tips on answering the most important Microsoft Teams user experience questions from a single source – Martello’s Vantage DX. Our latest release packs in more Microsoft Teams call quality insights than ever before – book a demo today.