
Using Microsoft’s New Network Connectivity Insights Tools
Microsoft Office 365 Performance
Microsoft’s new network insights tools – recently released as a preview – provides an overview of connectivity to your tenant and gathers information from the new Microsoft 365 network. These previews make it easier for administrators to better understand potential problems and whether users have good or bad connectivity to the service.
Although the tools are in preview mode, they can provide high-level insights that would be hard to understand without the use of third-party tools. What’s clear is that the preview tool offers different insights than other third-party products; it uses a combination of statistics such as location data provided by Windows via the OneDrive client. Essentially it is looking from the inside out instead of the outside in.
This subtle distinction makes a difference as it enables the display of relevant information that can be difficult to display. A good example is the service front-door people in particular offices are using to access Microsoft 365. Third-party products can’t reliably provide this information because Microsoft knows its internal network best and understands the location and network connectivity of servers hosting the front-door for services like Exchange and SharePoint.
How Third-party products differ from Microsoft’s new connectivity tools
- They are not reliant on Microsoft 365 being available to provide statistics – if there is a localized service outage for a subset of users this is unlikely to show in the connectivity statistics.
- Apart from user-submitted reports, the data shown is very broad-brush – it quickly gives you an overview but doesn’t allow you to drill-down into raw statistics very easily, and the overall assessment score is based upon data such as latency or download speed.
To get a feel for the tool we sampled it with a mix of test users, running in Azure-based locations across the globe, and real users spread across the UK with several daily users at each location and allowed network insights to spend some time returning data. The initial impression is that this tool will be extremely useful to organizations that currently have little to no visibility into client connectivity with Microsoft 365 or don’t know where to start. The key metrics – the assessment scores and points breakdowns mean that if you have widespread issues these should be immediately obvious.
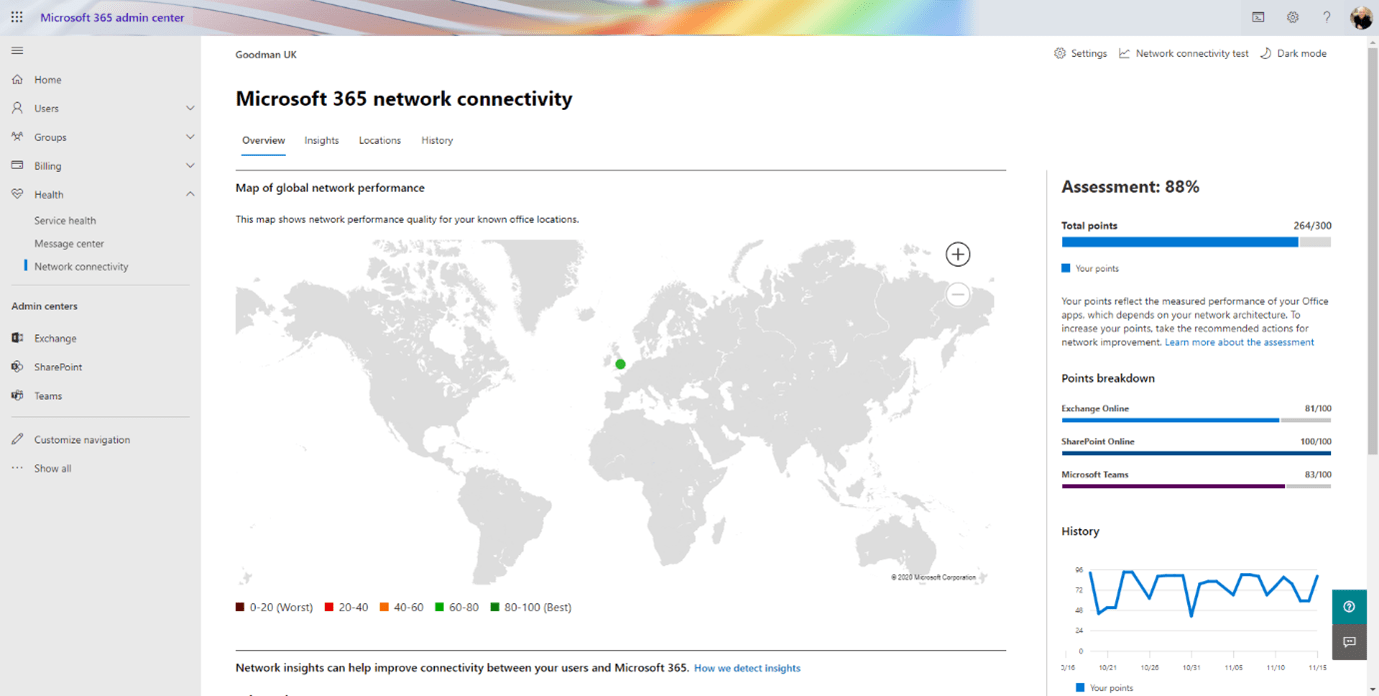
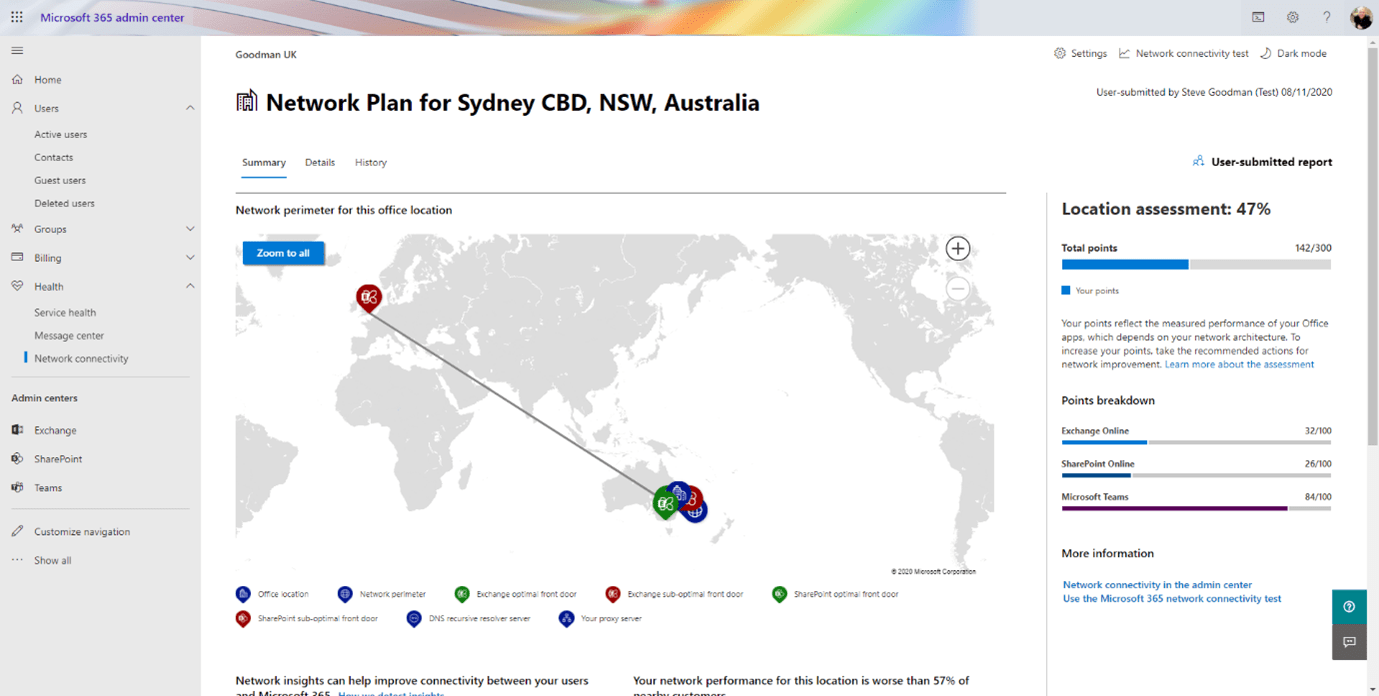
In the example below, you’ll see an overall assessment score is shown including detected office locations, breakdown scores for key services, and on the dashboard an overview of history and insights:
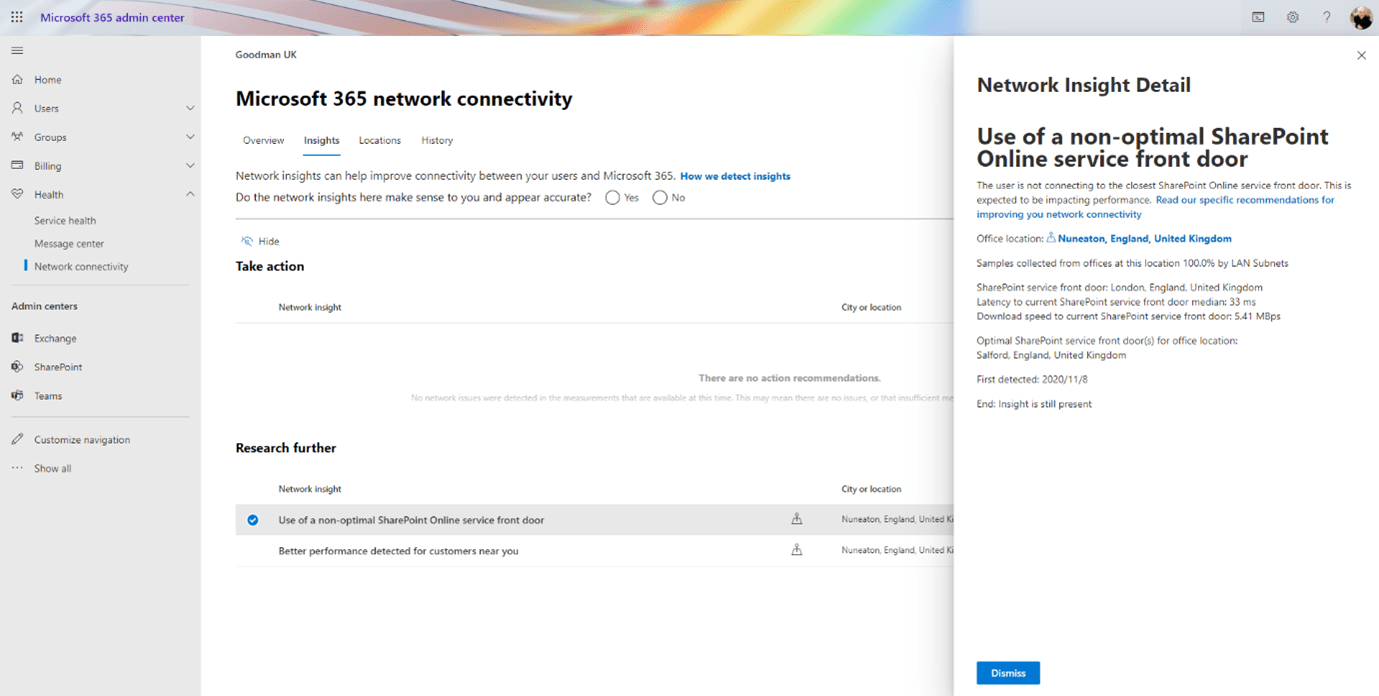
The Insights tab provides automated pointers specific to issues it has detected for users. In the example below, it has highlighted that a non-optimal SharePoint Online service front-door is being used at one of our locations. This breakdown shows when this issue was first detected, how it was detected, and if it is still occurring.
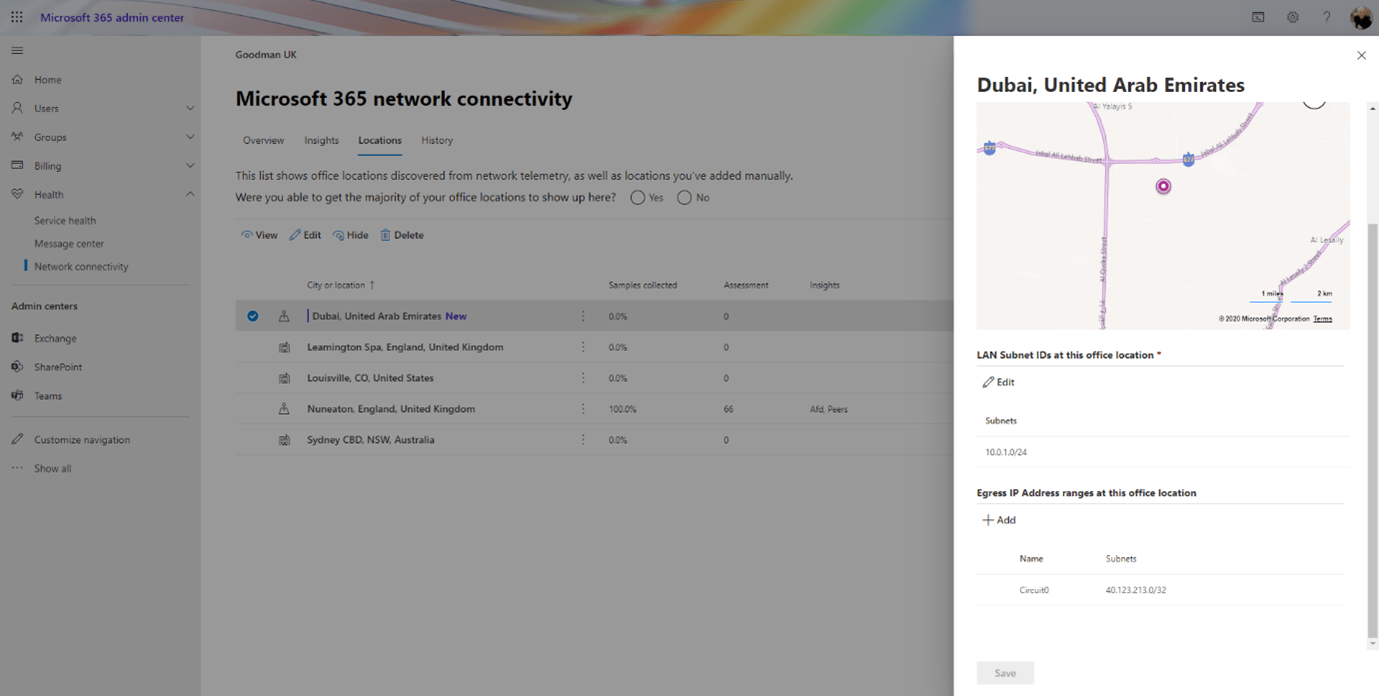
The Locations tab provides a mix of user-submitted reports, detected locations, and defined LAN and network egress IP ranges. Locations can be automatically detected based on Windows Location Services, with the OneDrive desktop client on PC being used to perform the detection on Wi-Fi enabled PCs, with administrators responsible for defining LAN subnet to location mappings manually:
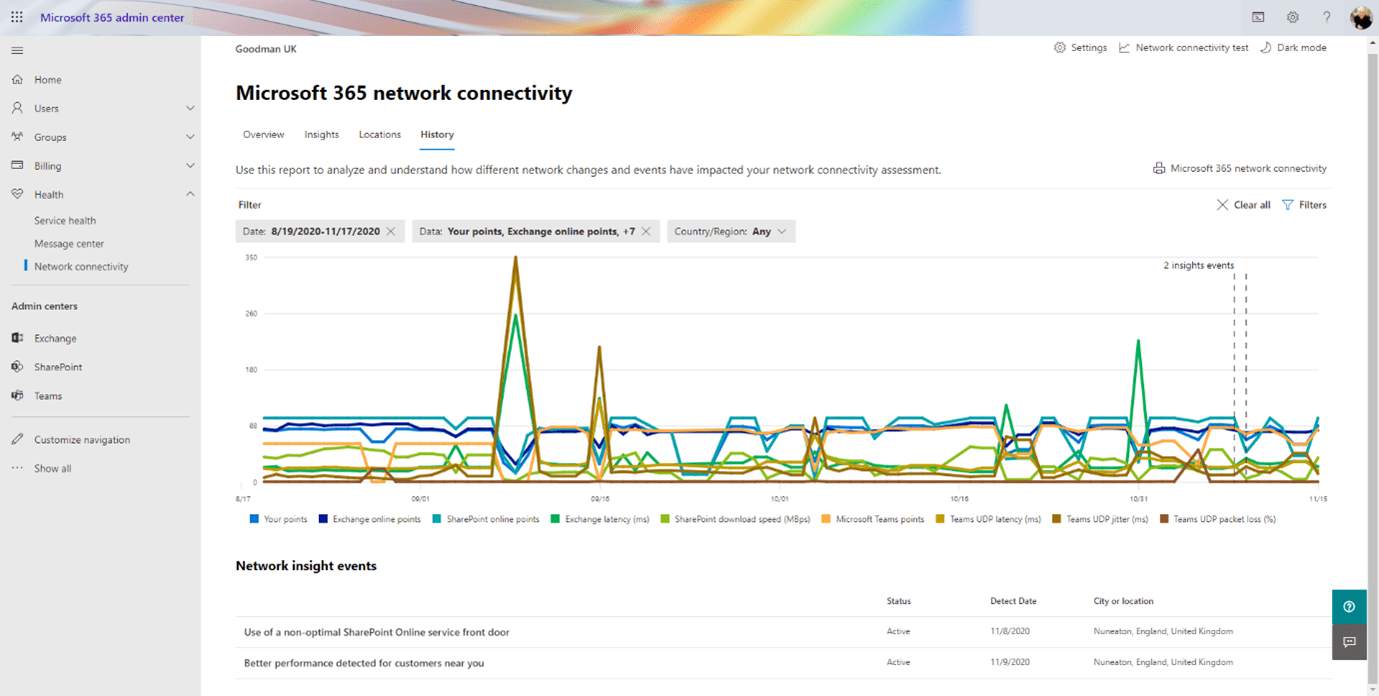
The History tab shows the overall score over time, with drill-down based on detected locations. In addition to the overall score, per-service scoring, Exchange latency, SharePoint download speed, and Teams latency, jitter, and packet loss is shown:
Overall, the capabilities of the preview tool are rather encouraging, however, there is room for improvement. Troubleshooting as to why data is not received by the portal presents challenges. It states that some data can take up to 24 hours to display it appears some data simply doesn’t make it to the overview whatsoever.
When testing the new portal, combined with the new network connectivity tool, using options to submit reports, I found that although data became available in the portal it was not used within the insights. In the above history graph, for example, some – but not all – locations I submitted reports from were shown.
The most challenging issues – such as DNS misconfiguration, which were obvious on the resulting connectivity tool report didn’t result in any insights or warnings being shown unless an administrator drilled-down to find the report and understood the cause of the issue.
In the example below, a client in Australia was configured with a DNS server in the UK. The report was available by drilling down into the Location tab, but unless an administrator found this specific report, they would be unaware of the issue. Even if they found the issue, the insights capability exposed on the report itself provided no recommendations.
However, it’s important to remember that the ability to see the user-submitted report centrally within the Microsoft 365 portal is a positive development – it certainly means that if a user claims to be experiencing an issue, you can react to it by asking them to sign-in and perform a test, then drill down into the point-in-time detail.
From a wider view, both the telemetry data and the network connectivity tool lack important insights that provide visibility into the user experience. Rather than perform regular synthetic transactions at key locations, the aggregated data from multiple clients reports on some key metrics that could be used to guess at responsiveness, but wouldn’t realistically provide any evidence as to whether things are truly good or bad for users.
For example, if several users reported that they were unable to post a message in Microsoft Teams, upload a file, or believed emails were not being delivered – this tool would not be able to assist. It doesn’t give real-time statistics that you could use on a live dashboard to provide certainty that the user-experience with Microsoft 365 remained operational.
Instead, it is better suited to help you discover and identify broad problems and then follow guidance to remediate those issues. If you are running Microsoft 365 for your business and have users in more than one office- and have not performed any basic network configuration prior to deploying Exchange, Teams, or SharePoint- then you should use this tool to highlight existing configuration problems that you can solve.
If you have already followed best-practice guidance for ensuring your clients have good connectivity to Microsoft 365, then you’ll gain less value from this tool. It will however give you an aggregate view of new issues that occur, or issues that happened several days ago and are now resolved.
If you need to be able to drill-down into the true user experience at a particular office in near real-time and gain in-depth statistics, then you will need to keep looking. If you need to check in-depth information about a user experiencing issues with Teams calls, then this tool will not help, nor will it provide insights into call quality. – Those instances require the use of a third-party tool or interrogate data within the Teams Admin Center.
To validate the user-experience by determining whether files can be:
- successfully uploaded to OneDrive or go further than latency for email performance
- include on-premises information for hybrid environments
- provide near real-time views into the information for services such as Exchange Online and SharePoint Online
The use of third-party products will still be necessary.
Martello is the leading provider of Digital Experience Monitoring. We provide the only Microsoft 365 monitoring tool that truly measures the quality of the service delivered to all enterprises’ sites. Get started today with Microsoft 365 monitoring and see how you can keep your employees on the path to optimal productivity.
Written By: Steve Goodman, Microsoft MVP