How to Use the Key Performance Metrics you Already Have to Improve the Microsoft Teams User Experience
Microsoft Teams Monitoring
In any organization, the IT operations teams bear the responsibility of providing reliable cloud services to users that are increasingly distributed, working from home, the office, or elsewhere. As a result, IT professionals are looking for solutions to achieve visibility of the user’s network from end to end to quickly identify and resolve bottlenecks and ensure maximum productivity and ROI of their cloud applications. This can be attained by utilizing the key performance metrics for Microsoft that you already have.
What IT Teams Need
To achieve this end to end network insight, IT teams need the ability to:
- Access regular end-to-end tests from where the users are working.
- Collect critical metrics such as RTT, packet loss, jitter, wifi signal and the ISP used.
- Be alerted on key performance metrics for Microsoft with enough flexibility to limit alert storms.
- Easily visualize where the network points are and their issues.
- Correlate Teams monitoring data with existing internal network monitoring tools.
- Achieve the needed insight without the requirement to install and maintain any probes on each user machine.
Until recently that sounded like an impossible request. But newer approaches in digital experience monitoring that are focused on leveraging the network health and performance data from existing sources have made this possible.
The Data Sources
In most organizations, there are a few sources of data that can provide insight into the key performance metrics of a Microsoft Teams call. However, each has limitations when it comes to alerting and reporting and none can provide a complete end to end visualization of all factors influencing call performance.
The first source is Microsoft itself. If you are a Microsoft Teams administrator you might already know that for each user call, Microsoft Teams is collecting the exact information needed by the network team to get full visibility on the entire internal and external infrastructure. Teams has many strengths but it is not designed to visualize, alert or correlate network and call data with the existing infrastructure. In a sense, you can think of each Microsoft Teams call as a kind of speed-test performed by any user because of the valuable data collected. The key is to find a way to visualize and alert on this data in a way that is actionable for IT teams.
The second source is the internal network monitoring tools such as SCOM, Nagios, PRTG, BMC, Cisco, Azure Monitor and ITSM tools such as ServiceNow, Jira, and Topdesk, that most organizations already have in place. These tools each provide valuable insight into the health status of the various components and devices in the IT infrastructure. However, they do not synchronize with each other or with the data provided by Microsoft and each produces its own set of alarms, creating alert storms that make it difficult to pinpoint critical problems that are impacting the Microsoft Teams user experience.
Synchronized End to End Visualization
Getting the right network performance data from all your users on a single dashboard
Vantage DX has been designed to specifically monitor the entire route to the cloud from user to Microsoft datacenter, correlating Microsoft Teams call and network data with an organization’s internal monitoring tools to provide enriched service incidents when needed to the ITSM team. The goal is to streamline Microsoft Teams service quality management to ensure business productivity and maximum ROI for our customers.
Multiple times per day, the platform collects and makes available a wealth of data including: the type of endpoint, connection type (wifi, wired), client wifi signal strength, client bandwidth estimate, client and endpoint IP, forward and reverse Jitter, forward and reverse RTT, forward and reverse video frame rate and client top 50 latency.
To make this data more actionable, IT teams need to be able to group it by users/endpoint, decide when they are a point of concern (thresholds), then be alerted when it matters most and correlate it with existing monitoring data. Here’s an example of how the Advanced Visualization capabilities in Vantage DX can enable IT teams to do just that.
Real User Network Experience Visualization
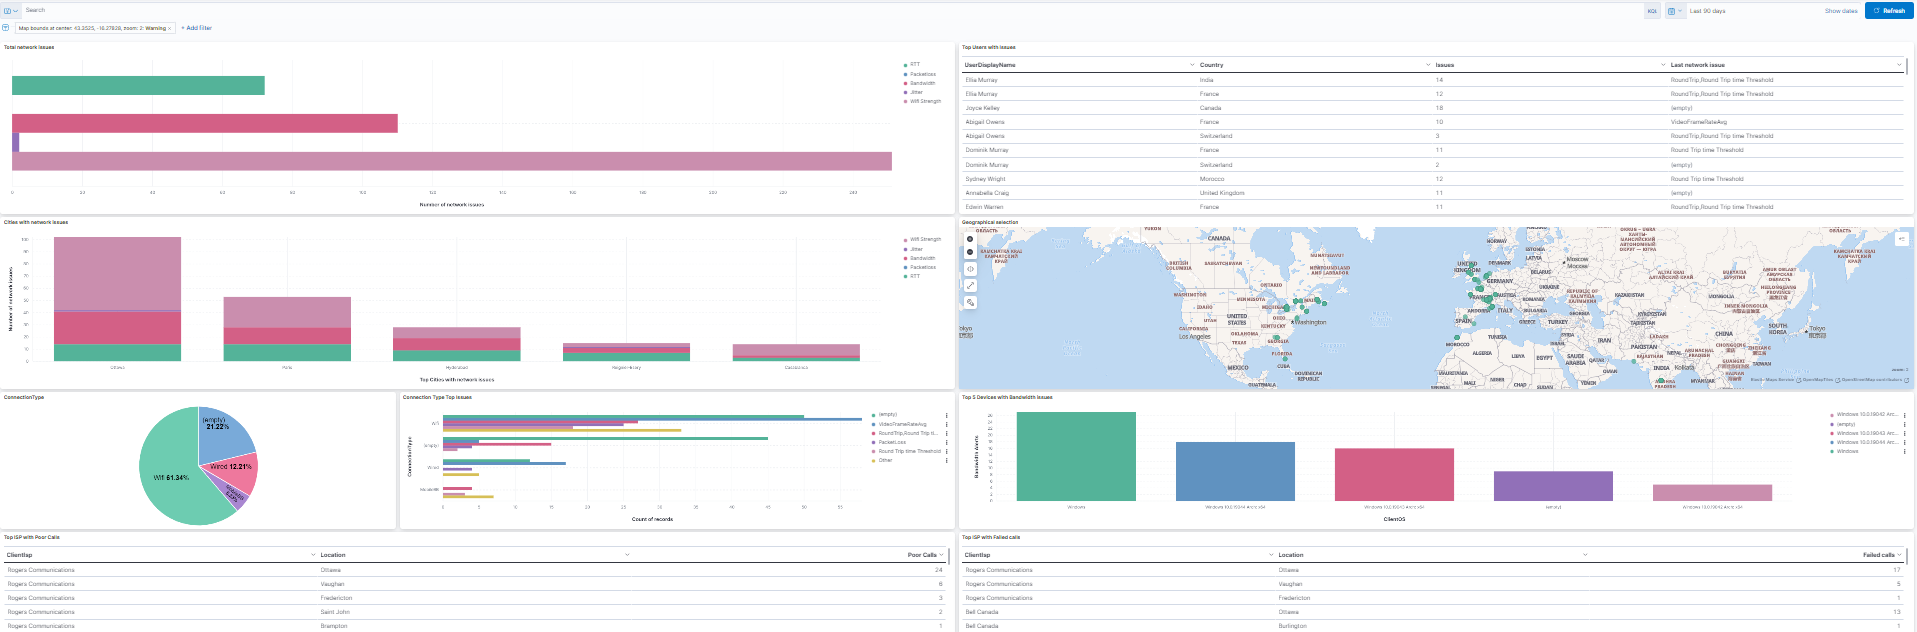 Vantage DX collects all user network information and presents it in interactive dashboards that can be easily used to understand global and local bottlenecks affecting users both inside and outside of your organization.
To highlight what matters most to IT, the platform applies automatic threshold filters. It then displays every call and test specifically which one of these thresholds have been breached, providing IT personnel with a clear map and dashboard of where the problems truly are.
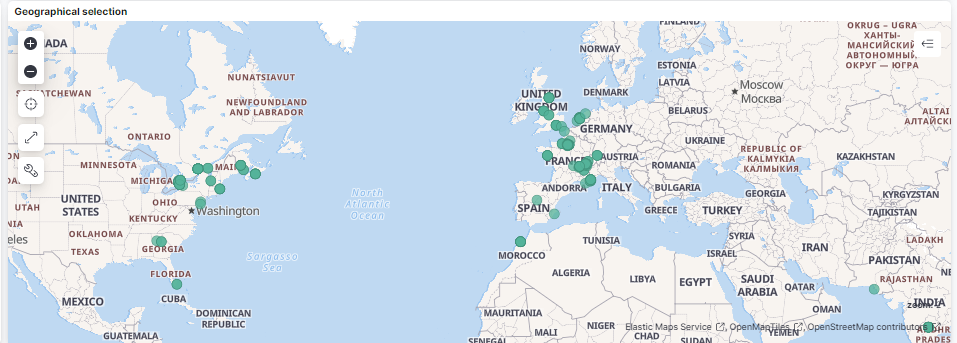 The map allows you to navigate geographically in order to focus on a specific area where network issues have been found.
In order to simplify the prioritization of IT efforts when it comes to network experience, you need an automatic aggregation of the issues per city.
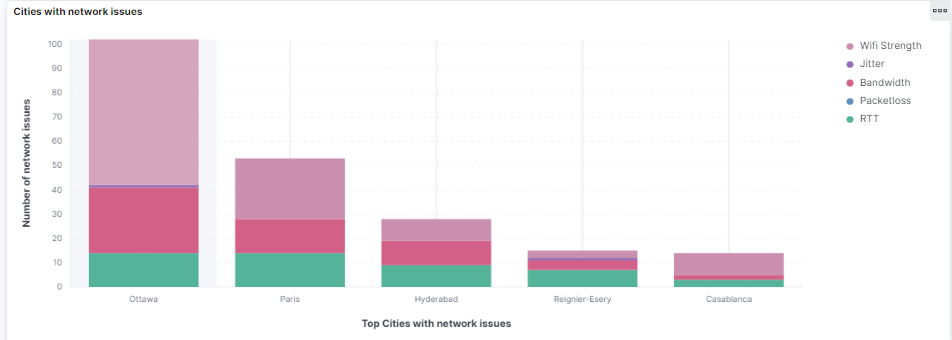 Using this chart above, you can immediately see where the lowest performing city is and why. This helps to quickly identify priorities for network improvements that should occur and can highlight what improvements will benefit your organization the most.
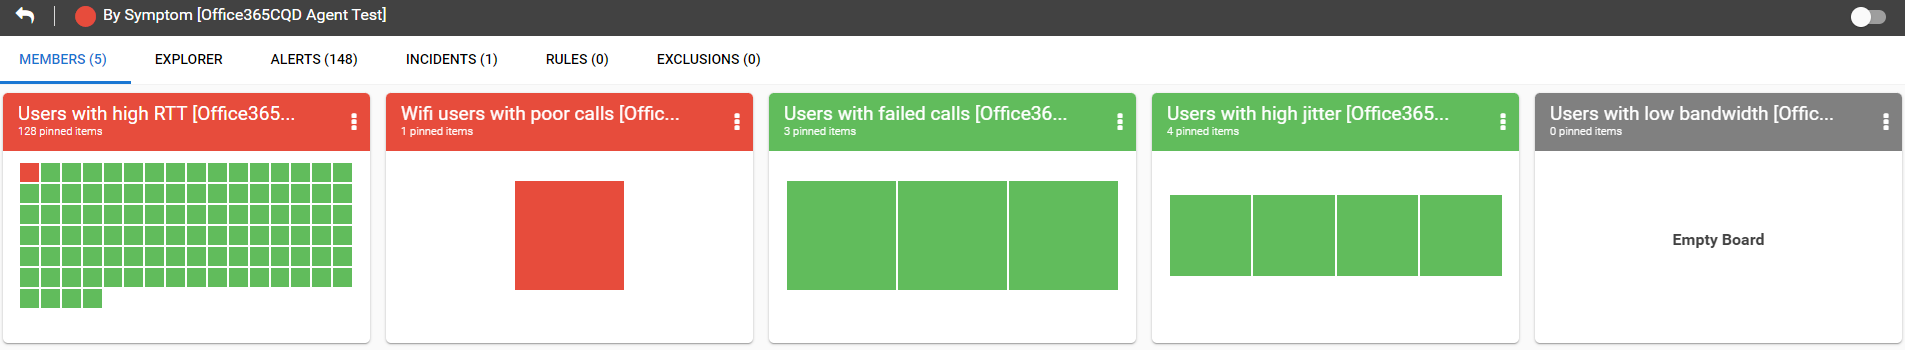
Microsoft Critical Alert
When assessing the network experience, especially at the user level, it is key to be able to group, correlate and synchronize alerts with existing Operations and ITSM tools and processes. Grouping the alerts allows for an efficient response and can reduce alert storms that pull critical resources away from more productive work.
For example, you can group the test results by type of issue:
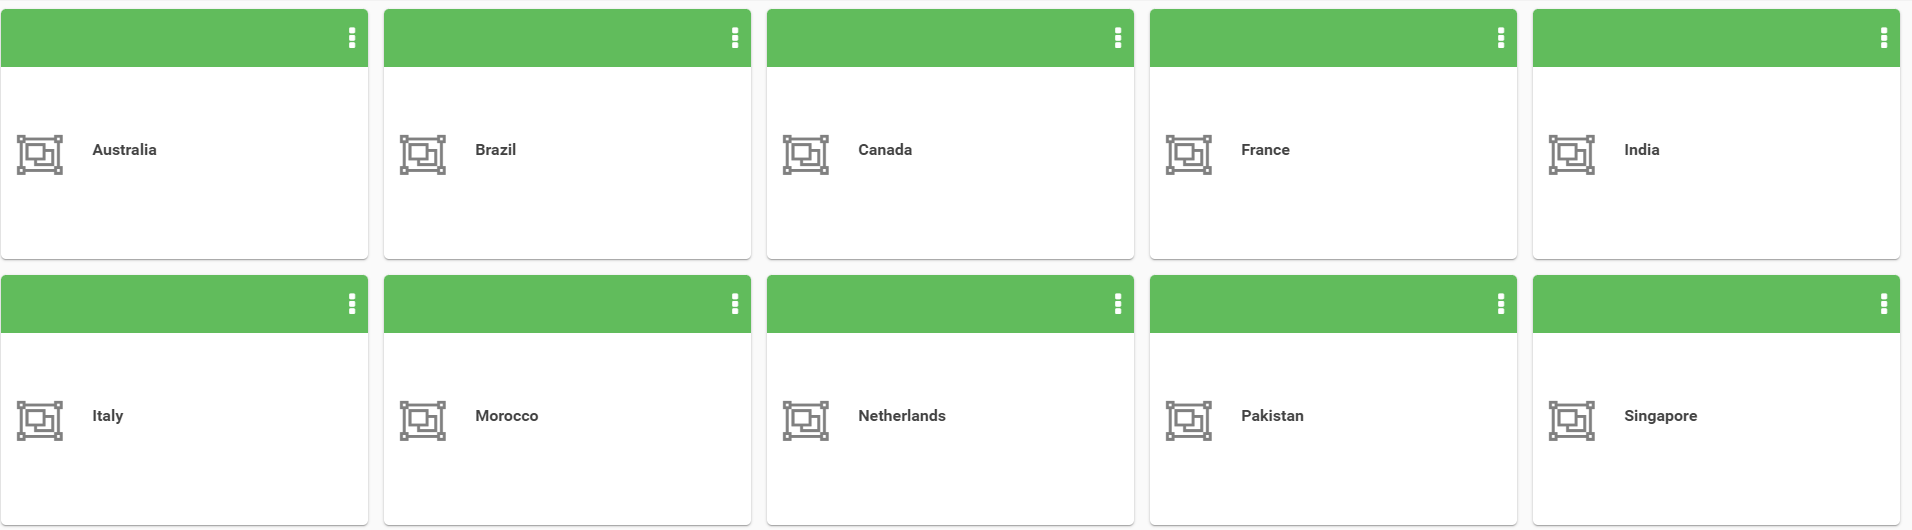
 By location:
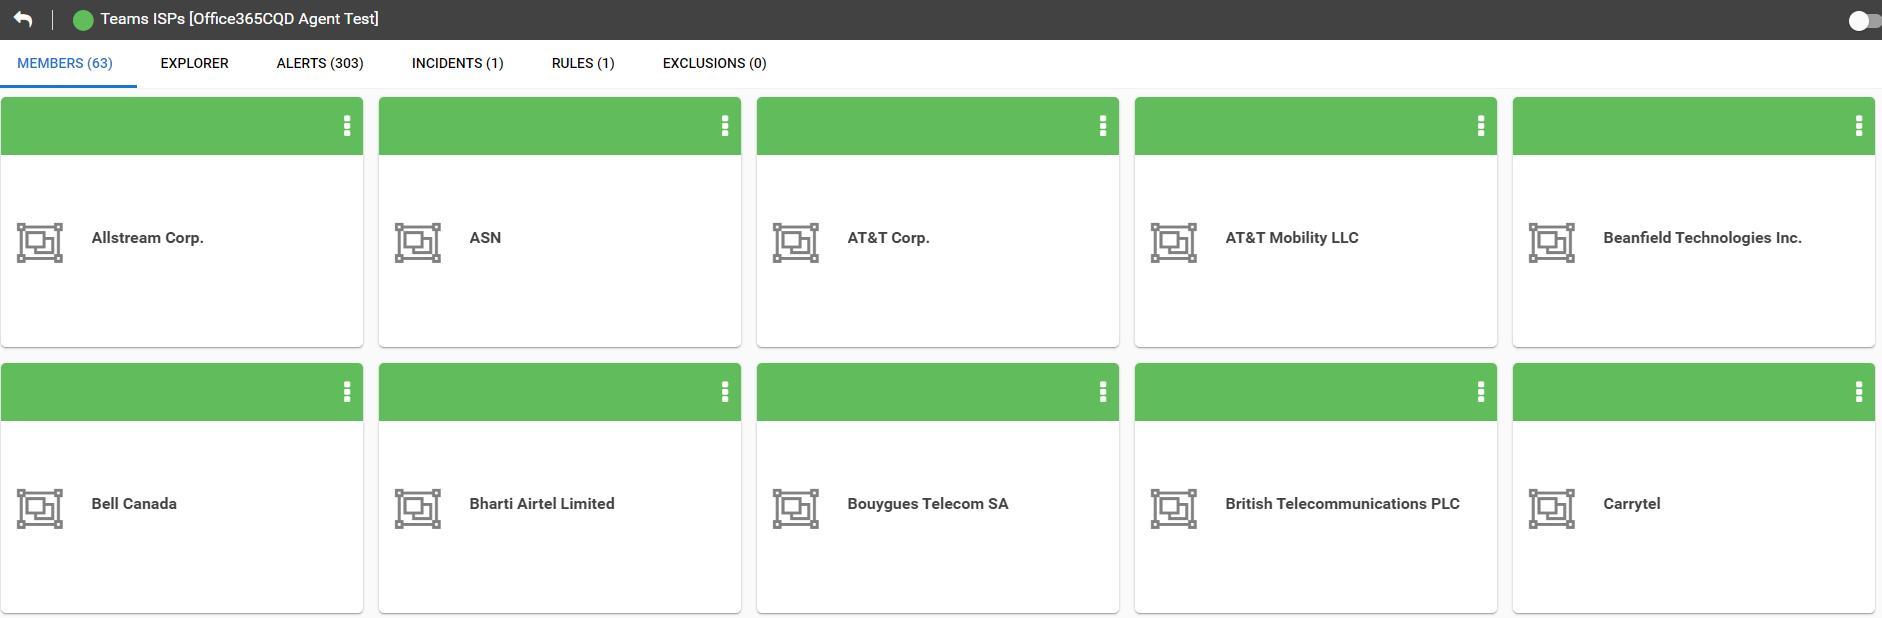
 By ISP:
Vantage DX offers a unique way to assess the network performance of your organization, by easily correlating internal insights with end-to-end performance metrics for Microsoft Teams no matter where your users are located. These capabilities are at the heart of any network strategy, encompassing internal and external components for the delivery of business and cloud applications to organizational business lines.
Learn more about Vantage DX.